Simulation solaire
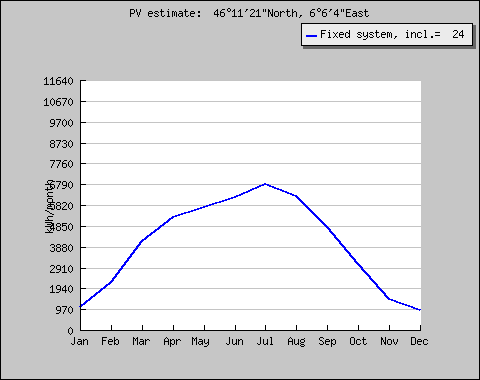
Performance of Grid-connected PV
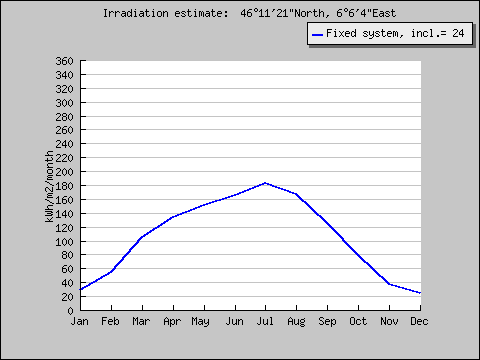
PVGIS estimates of solar
electricity generation
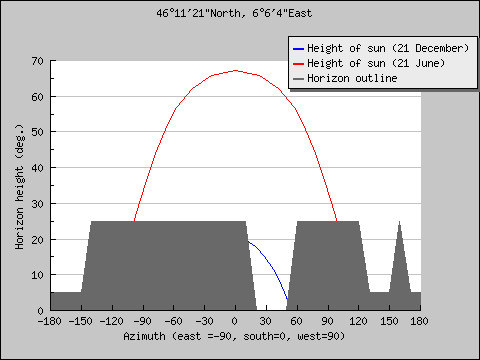
Location:
46°11'21" North, 6°6'4"
East, Elevation: 421 m a.s.l.,
Solar radiation database
used: PVGIS-classic
Nominal power of the PV system: 48.5 kW
(crystalline silicon)
Estimated losses due to temperature: 9.8%
(using local ambient temperature)
Estimated loss due to angular
reflectance effects: 2.7%
Other losses (cables, inverter etc.):
10.0%
Combined PV system losses: 21.0%
|
Fixed system: inclination=24°, orientation=-20°
|
|
Month
|
Ed
|
Em
|
Hd
|
Hm
|
|
Jan
|
35.30
|
1090
|
0.92
|
28.6
|
|
Feb
|
79.60
|
2230
|
1.96
|
54.8
|
|
Mar
|
134.00
|
4160
|
3.38
|
105
|
|
Apr
|
175.00
|
5250
|
4.47
|
134
|
|
May
|
185.00
|
5730
|
4.87
|
151
|
|
Jun
|
206.00
|
6170
|
5.51
|
165
|
|
Jul
|
220.00
|
6810
|
5.92
|
184
|
|
Aug
|
202.00
|
6260
|
5.40
|
167
|
|
Sep
|
160.00
|
4800
|
4.17
|
125
|
|
Oct
|
99.50
|
3080
|
2.55
|
78.9
|
|
Nov
|
48.40
|
1450
|
1.25
|
37.4
|
|
Dec
|
29.90
|
928
|
0.79
|
24.6
|
|
|
Yearly average
|
131
|
4000
|
3.44
|
105
|
|
Total for year
|
48000
|
1260
|
Ed: Average daily
electricity production from the given
system (kWh)
Em: Average monthly electricity production
from the given system (kWh)
Hd: Average daily sum of
global irradiation per square meter received by the modules of the
given system (kWh/m2)
Hm: Average sum of
global irradiation per square meter received by the modules of the
given system (kWh/m2)
PVGIS © European Communities,
2001-2010
Reproduction is
authorised, provided the source is acknowledged